❖Video - Overview of the Pipeline Report Training Video
❑To better understand the Sales Flow process within your Company, you will need reliable and consistent Answers to these types of Questions:
1.What Potential Sales are in my Company's "Sales Pipeline"?
2.How old are those Leads?
3.Where are these Leads coming from?
4.Have we provided these Potential Customers a Proposal?
5.What's the Status of these Potential Sales?
6.Which Salespersons have Leads that need follow-up?
7.How much are these Potential Sales worth?
•The Pipeline Analysis Report dialog will help you get the Answers to these Questions and so better understand the Sales Flow process within your Company.
➢Note: The Pipeline Analysis Report uses the Status field in the Lead Information section of the Edit View of the Subscribers Form and the Status field in the Edit View of the Prospects Form to determine whether a Prospect or Subscriber should be considered (included) in this report.
a)Any Prospect who has been assigned an "Inactive" Status will be excluded.
b)Any Subscriber with an "Inactive" Status or the Status field is blank (i.e., NULL) in the Lead Information section of the Edit View of the Subscribers Form will be excluded.
c)During a conversion of a Prospect to a Subscriber, the Status field entry will be populated with any corresponding Status entry in the Edit View of the Prospects Form.
d)Open the Pipeline Report Video Tutorial below to view an overview of this report's features and usage
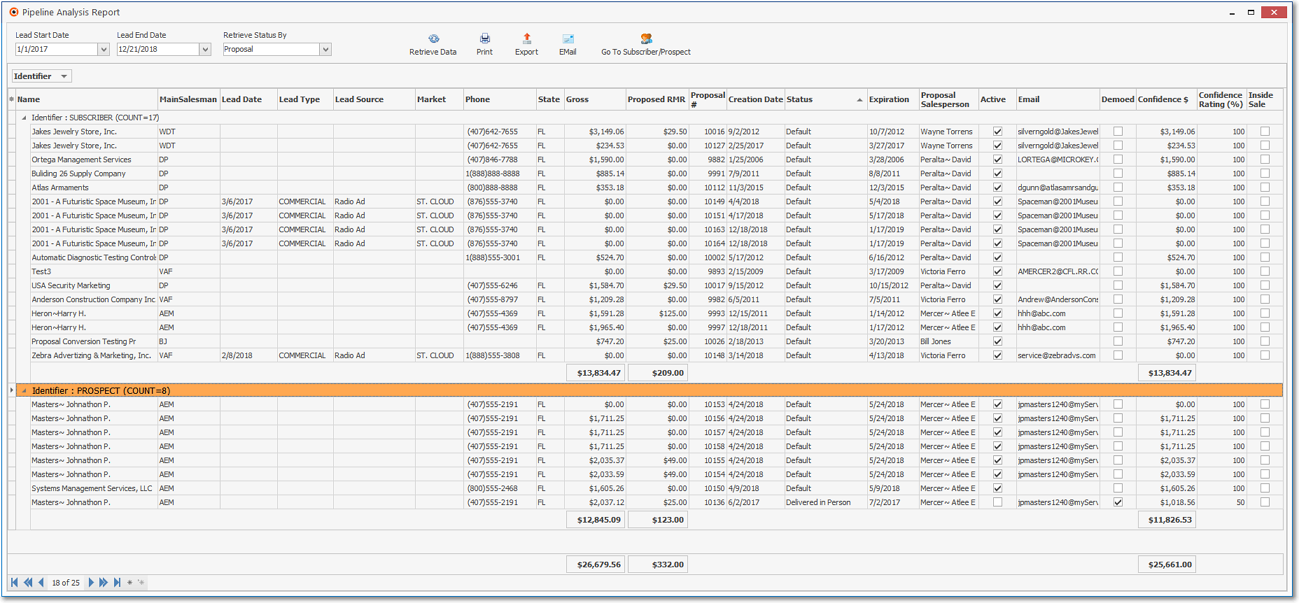
❑The Pipeline Analysis Report dialog is a fully functioning data grid that lists Subscribers and/or Prospects who have a Lead Date and Status identified, and/or who have a Proposal enter which has not been converted.
•This Lead Date and Status information is entered in the Lead Information section of the Edit View of the Subscribers Forms and/or the Lead Information section in the Edit View of the Prospects Form
✓To be included in the data grid, the Lead Date must fall within the User specified Date Range
•Subscribers and Prospects who meet the above qualifications, could be listed multiple times, once for each Proposal that has not been converted.
✓However, Subscribers and/or Prospects will also appear in this report if they have no Proposals, but do have a specified (Sales) Status and a Lead Date that falls in the specified Date Range.
•To view or print this Pipeline Analysis Report:
a)From the Backstage Menu System Select Reports and Choose Prospect And Proposal and Select the Pipeline Analysis option, or
b)From the Quick Access Menu, Select Reports and Choose Prospect And Proposal and Select the Pipeline Analysis option
❑ Setting Up the Pipeline Analysis Report dialog's data grid Options:
•Setting the Date Range - By default the Date Range offered will be the Date Micro Key was started, to Today, but the User may specify any Range of Dates to be used to determine which records will be included in the Pipeline Analysis Report dialog
✓Lead Start Date - Use the Drop-Down Calendar/Date Entry field to change the starting date, as required.
✓Lead End Date - Use the provided Drop-Down Calendar/Date Entry field to change the ending date, as required.
a)Click on the Date field and type the desired Date using a MM/DD/YYYY format; or
b)Use the Drop-Down Calendar/Date Entry field provided to Choose the desired Date
•Retrieve Data - Once the appropriate Date Range is specified:
✓Click the Retrieve Data Icon to load that selected set of records into the Pipeline Analysis Report dialog

Retrieve Data
•Go To Options - Right-Click on any line item within the Grid to open the Radial Right-Click Menu to access the Go To Subscriber/Prospect (which will open the associated Subscriber or Prospect Form), or Proposal option (which will open the associated Proposal Form).
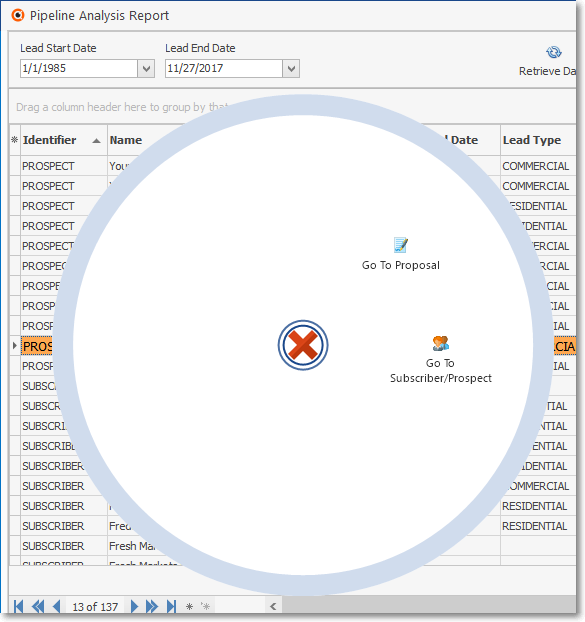
Pipeline Analysis Report - data-grid - Radial Right-Click menu
•Print - When the Pipeline Analysis Report data has been formatted as needed, the User may Click the Print Icon to create a Print Preview.
•Export - Once the data has been formatted, filtered, sorted and configured as needed, Click the Export Icon to display the standard Windows® Save As dialog.
✓See the data grid chapter for more information.
•EMail - Once the data has been formatted, filtered, sorted and configured as needed, Click the EMail Icon to send this data as a PDF attachment to an Email address of your choosing.
•Go To Prospect/Subscriber - Click this Icon which will open the associated Subscriber or Prospect Form for the selected Proposal.
•Accessing a Proposal Form - To open the associated Proposal Form, Double-Click and any line item which has a Proposal Number (Proposal #).
❑Configuring the Pipeline Analysis data grid:
•Select columns to be displayed - Choose the columns of data which are to be included in this data grid
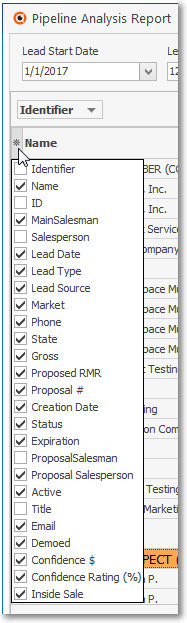
Select Columns to Display
•Click the asterisk (¬) at the left of the data grid's Header row (see the mouse pointer in the illustration above) to display a list of all of the column names - and associated data - which may be displayed.
•By default, all Column Names will be Checked.
•Remove the Check mark (Click on the Check to remove it) to hide that column of data from the data grid.
❖Also see the Understanding and Using the Confidence % and Confidence $ fields discussion in the Proposal chapter.
•Setting the Order in which the data in the grid is Listed within the Pipeline Analysis Report dialog:
✓The default sorted order of the List is based on the Name regardless of whether or not that column is displayed (see the "Select columns to be displayed" discussion above) - and is ordered from lowest to highest (0 - 9, A - Z).
✓Thereafter, the column that determines the sorted order of the List may be easily changed, whenever needed.
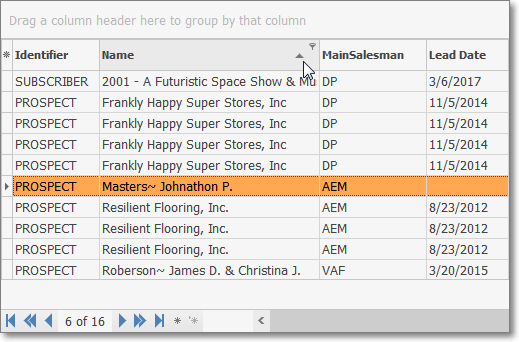
Pipeline Analysis Report dialog - Sorting by Column
✓To do so:
▪Click another column's Header Name (the mouse points to the sorting arrow within the Name Header Name in the illustration above) to change the sorted order to by on that column of data, with the sorted order automatically set from lowest to highest (a-z or 1 - 9).
▪To change this newly selected column's sorted order from highest to lowest, Click that column's Header Name again.
▪An Arrow next to the Header Name indicates the column that is determining the sorted order of the Grid Data.
o~ indicates lowest to highest (a-z or 1 - 9)
o€ indicates highest to lowest (z-a or 9-1).
•Grouping the data in the grid - The Pipeline Analysis Report List may be separated into Groups based on a selected column's Header Name.
✓Click the Header Name (i.e., "Identifier" was selected in the illustration below) and Drag that Header Name to the "Drag a column header here to group by that column" message area at the top of the Grid.
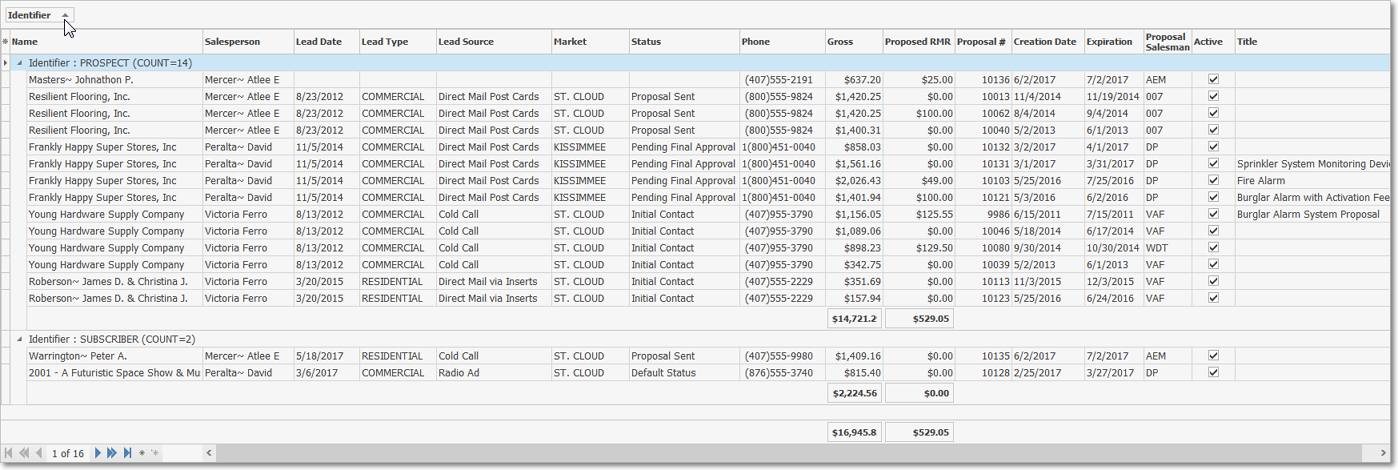
Pipeline Analysis Report dialog - Grouping by Column
✓See the Grids & Lists - Print Preview - Exporting Data chapter for much more information about Grouping the Pipeline Analysis Report dialog Data.
❑Pipeline Analysis Report - Output - The data is presented in a Grid format and therefore has all of the normal Grid features and functions such as Sorting, Relocating, and Filtering the data presented before it is Printed as a report, and/or Exported to a file.
a)Choose which columns of data are to be included,
b)Set the order in which they are to be listed, related any columns (if appropriate),
c)Adjust any column's width,
d)Then, when ready:
i.Print - Click the Print Icon at the top of the Form to display the Print Preview dialog.
ii.Export - Click the Export Icon to display Save as... Windows® dialog.
•See the Grids & Lists - Print Preview - Exporting Data chapter for much more information about formatting and printing (and exporting) the Proposals (Grid) Form's data grid
❖Pipeline Report Video - Click the Run Icon in the image below to view the video.
▪When finished watching the video, Click here to return to the beginning of the Pipeline Report instructions.

Prospect Tracking Systems's Pipeline Report
▪Or Press "Ctrl+Home" to return to the beginning of this chapter.