❑Quality of Sales report provides a Bar Chart along with a detailed Legend that provides an analysis of the Quality of the Accounts Receivable being added - viewed over a one year period ending in a specified Month and Year.
•The Quality Value is determined by taking the beginning Accounts Receivable Balance and then adding Sales, then subtracting the ending Accounts Receivable Balance to get the Quality value which is the percentage of difference.
•To access the Quality of Sales dialog:
a)From the Backstage Menu System Select Reports and Choose Receivable Reports, or
b)From the Quick Access Menu, Select Reports and Choose Receivable Reports
✓On the Receivable Reports Menu, Choose the Quality of Sales option to display the Quality of Sales dialog shown below.
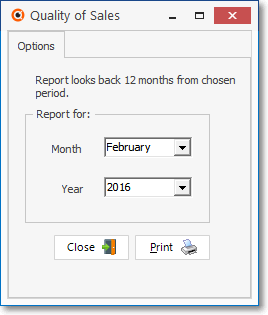
Quality of Sales - Options tab
❑Quality of Sales tabs - There are three tabs on the Quality of Sales report dialog.
•Options - Initially only the Options tab is shown (until you make your Options selections and Select Print).
✓Report for: - Specify the Month and Year representing the end of the one year period to be analyzed.
▪Month - Use the Drop-Down Selection List to Choose the end of the last Month to be analyzed.
▪Year - Use the Drop-Down Selection List to Choose the end of the last Year to be analyzed.
❖To help you understand these Month and Year entries and the Quality of Sales report as a whole:
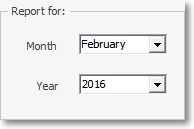
▪ In the screen illustration above February of 2016 was selected.
▪The result will be a Quality of Sales analysis of the 12 months of March 2015 through February 2016
▪The Chart tracks:
oNew Sales for each Month
oStarting Accounts Receivable for each Month
oEnding Accounts Receivable for each Month
oThe Resulting Quality of Sales calculation
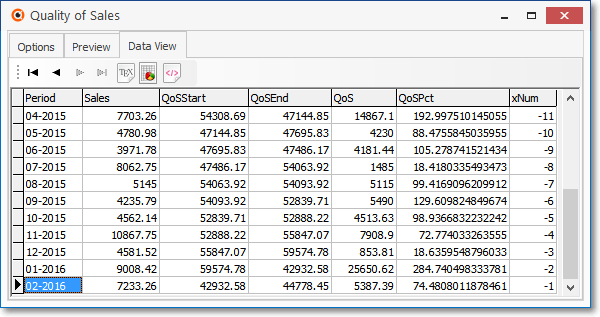
▪The data in the screen illustration below incorporates these calculations within this time frame.
•Print - Click the Print button ![]() to Preview and optionally Print this Quality of Sales report.
to Preview and optionally Print this Quality of Sales report.
✓To Exit this Report dialog, Click the Close button ![]() toward the bottom of the Options tab.
toward the bottom of the Options tab.
❑The Preview tab presents the report which resulted from the Options you've selected.
•Up Arrow/Down Arrow - hi - Moves the report one line up, or one line down, respectively.
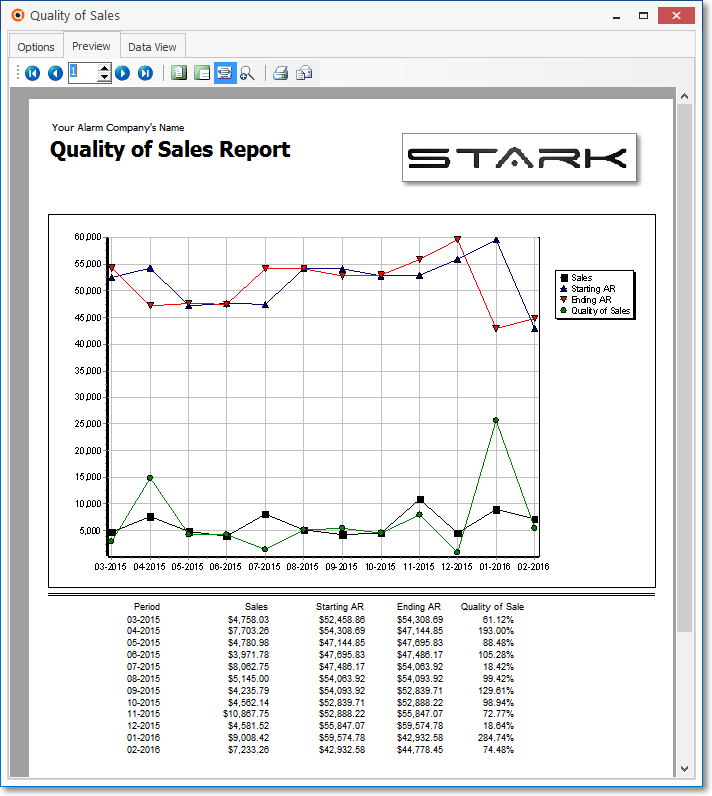
Quality of Sales Report - Preview tab
•Number - Indicates the page number you are viewing.
•Fit To Page - Click the first button after the arrows to size a full page of the report to fit the screen.
•Zoom To 100% - Click the second button after the arrows to display the page at 100% (of the printed view).
•Fit To Page Width - Click the third button after the arrows to size the page of the report to fit the full width of the screen.
•Zoom To Percentage - Click the fourth button after the arrows to re-size the page of the report by percentage.
![]()
✓When you Click the Zoom To Percentage button, the Percentage selector will be displayed.
✓You may then Click the Up or Down ‚ arrows to set the exact amount of Zoom you want.
•Print - Click the Print button ![]() to Print the displayed Quality of Sales report.
to Print the displayed Quality of Sales report.
•Email - Click the Email button ![]() to send the Report to an Email Address of your choosing.
to send the Report to an Email Address of your choosing.
•To Exit the Preview tab and Close this Report dialog Form, Click the Close box ![]() on the right at the top of the Preview tab.
on the right at the top of the Preview tab.
❑Data View - This view provides a tabular (spreadsheet style) presentation of the selected Quality of Sales report data.
Quality of Sales Report - Data View tab
•Arrows - Click the arrows to move through the record.
•Export - Exporting the data from this Data View tab (note the "fly-over" help available on these buttons):
✓Export to CSV - Click the first button after the arrows to export the data to a Comma Separated Values (CSV) file format.
✓Export To Excel - Click the second button after the arrows to export the data to an Excel (.xls) file format.
✓Export To Html - Click the third button after the arrows to export the data to an HTML formatted file.
•To Exit the Data View tab and Close this Report dialog Form, Click the Close box ![]() on the right at the top of the Data View tab.
on the right at the top of the Data View tab.